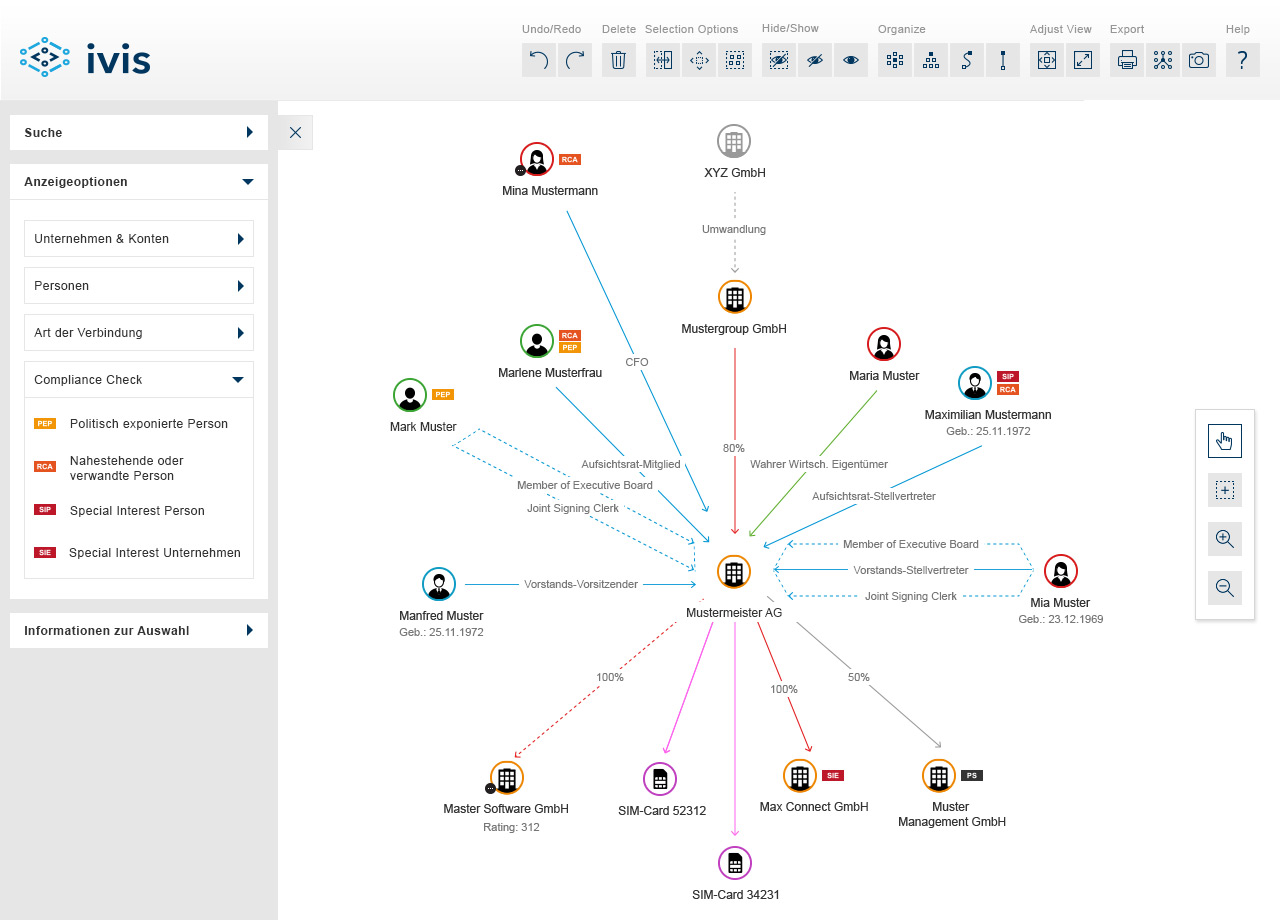
IVIS allows you to gain new insights into complex data

There are many different ways to look at structured data. Most of the time, it’s laid out in spreadsheets and presented in the form of bar graphs, line graphs or timelines. What you see is what you get: quantified data. But what you don’t see – and therefore hardly ever get – are the connections and dependencies hidden within the data. IVIS is an information visualization solution that allows you to see those at a single glance!

Key benefits

Spend less time, money and energy on analyzing data

Spend less time, money and energy on analyzing data

The human brain processes visual information more quickly than written one. Visual information enables you to analyze data faster and thus reduces the time before action can be taken, which in turn helps save costs.

Find hidden insights with real-life value in your data.

Find hidden insights with real-life value in your data.

IVIS enables you to interact with data in a meaningful way and thereby increases your chances of gaining new, applicable insights, while also allowing for a better overall understanding of the underlying structures.

IVIS can be used by anybody, no technical skills required.

IVIS can be used by anybody, no technical skills required.

IVIS is a web based solution for unlimited users. All users, regardless of their level of technical expertise, can work with and gain insights with IVIS. Empower your analysts and increase the value creation potential within your team!

Key features

Easy Filtering

Combine filters to focus on important data and answer complex questions.

Fast search

Find things faster, with IVIS’ real-time search and AutoSuggest-feature.

Extended path analysis

Investigate connections between entities quickly and efficiently.

Multiple built-in layouts

Regroup and reorganize entities at a single click of a button.

Connect to i2 Analyst’s Notebook

Enhance IBM’s classic analytics-software with the powers of IVIS.

Export as PDF and image

Want to forward your results? Simply export your findings as an attachable file.

Want to see IVIS in action? Give it a try – for free!

We customize IVIS for every client’s specific requirements. You provide the data, we deliver a solution that fits your needs. Try the following demo to get an idea of what IVIS can do for you.

Meet the team

team_1

Thomas Havranek

CFE, tax adviser and state-certified expert witness for (forensic) accounting, risk mangement, compliance and corporate governance. Law Degree

team_2

Shariq Reza

System admin, expert for data mining, data visualization, web- and backend solutions and software development.

team_3

Florian Kalchmair

Tax adviser, state-certified expert witness for (forensic) accounting and  white collar crime, expert for big data analytics, fraud and IT-related offenses.

team_4

Michael Zellinger

Head of IT forensics at CIN Consult, expert for social network analysis, eDiscovery, Email Analytics and Ligitation Support.

Use cases

Anti-fraud and compliance

Banks, insurance companies and financial institutions all face a common problem: fraud. Graph visualization helps them to detect suspicious connections or patterns across large networks of people, companies and organisations.

Cybersecurity

Nowadays, many companies constantly monitor their servers, networks and applications in order to detect suspicious activities. Graph visualization is a great tool to help digest this data and to uncover ominous patterns and events.

Law enforcement

Most law enforcement agencies collect and analyze data from various sources on a daily basis. Visualizing connections between people, emails, transactions or phone records has become key in modern day criminal investigations.

Life science

Protein interactions, drug compositions, disease networks: in the life sciences, data analysis is all about finding and tracing connections and dependencies. Graph visualization makes large amounts of data easier to read and understand.

IT operations management

This field keeps growing exponentially with the general publics’ increasing reliance on computer systems and the Internet of Things. Graph visualization allows IT managers to visualize complex networks and depenencies between assets.

Enterprise architecture

With graph visualization, enterprise architects can visualize an organizations’ assets and their dependencies. It allows them to conduct impact analysis, obtain insights on the current situation and promptly suggest further actions.

Contact us!

ivis_symbol

Phone:
+43 1 716 05 900

Address:
Beatrixgasse 30, A-1030 Vienna